
The oceans are changing. As the largest carbon sink, they absorb more carbon dioxide than all the trees and plants on land combined. Oceans also absorb the majority of excess heat caused by greenhouse gas emissions. As a consequence, waters are becoming warmer, more acidic, depleted of oxygen, less nutrient-rich and increasingly fresh, meaning less salty. These changes are intensified at shallower depths, but affect the entire water column, up to the deepest waters that flow just above the seafloor.
How do we know and monitor all of these changes? For decades, scientists have worked on developing lab techniques and electrical sensors to measure the oceans’ properties across the whole water column. From the early 1980s till present day, most of the deep-ocean observations rely on scientists going at sea. From aboard a research vessel, tools designed to withstand high pressures can be lowered off the back of the ship. Electrical sensors send real-time measurements back to the ship, while water samples are collected to be analysed on board.
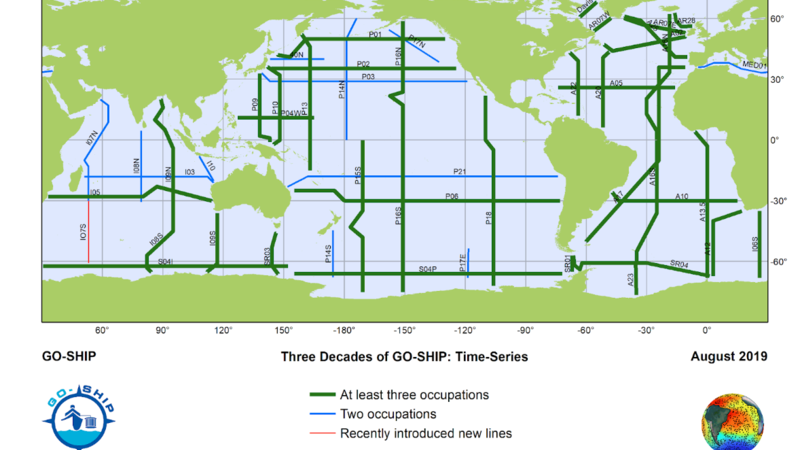
Thanks to the Global Ocean Ship-based Hydrographic Investigation Program (GO-SHIP), there is an international program to coordinate where, when, how and what to measure. The map below shows the main measurement routes. Each line has specific stations marked by GPS coordinates where measurements must take place. The thick green routes have had at least three repetitions in the last five decades. Data going all the way back to the 1970s has been organised and uploaded so that anyone can get access online.
ICCS researcher, Dr Laura Cimoli sailed on one of the specialised GO-SHIP vessels to help monitor the ocean physics and chemistry in the North Atlantic. As the Co-Chief Scientist, she supervised the 24/7 operations making sure everything went to plan, making adjustments when bad weather or technical issues got in the way. Working twelve hour shifts for over a month, Laura and the team arduously collected real-time temperature and salinity data and then analysed water samples for their chemical content.
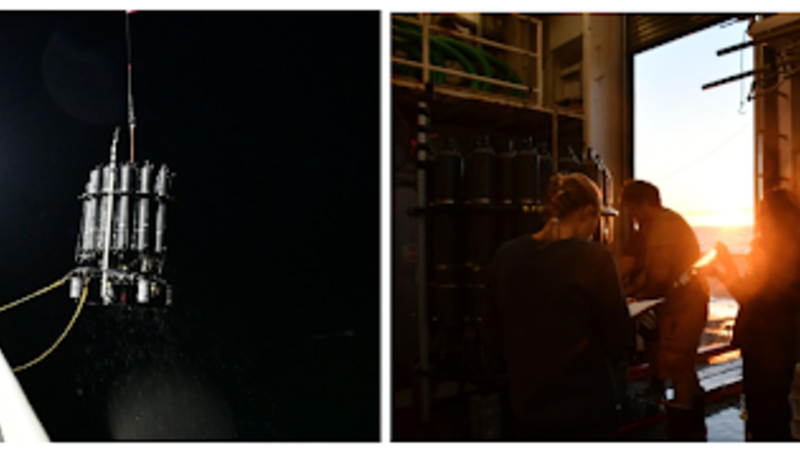
Photos by Laura Cimoli during her night-shift from her time aboard the research vessel Ronald H. Brown. Left: CTD is recovered back on board. Right: Scientists sample the water at sunrise.
Observations were made using a CTD, which stands for Conductivity, Temperature and Depth. As the instrument travels down towards the sea floor, a set of electronic sensors reveals how warm, salty and oxygenized the water is. The CTD also carries several cylindrical bottles used to sample the ocean waters at different depths. The bottles remain open during the descent and shut at specific depths on the way up so that water can be analysed in the lab on board.
In the labs, scientists measure the water carbon concentration, pH (a measure of acidity), oxygen, and other gases known as chlorofluorocarbons (CFCs). The carbonate chemistry of the ocean is fundamental to understand how much carbon dioxide is ending up at different depths. CFCs have a bit of a different history. They started to be mass produced in the 1930s for use in various products like fridges and spray deodorants. However, their introduction caused the thinning of the ozone layer, a part of the atmosphere that blocks out damaging UV rays from the sun. Global decision makers came together to ban them in 1987 (with the Montreal Protocol), and the ozone hole has now largely recovered. Interestingly, the ocean holds a memory of this time, allowing scientists to track how water is moving at various depths.
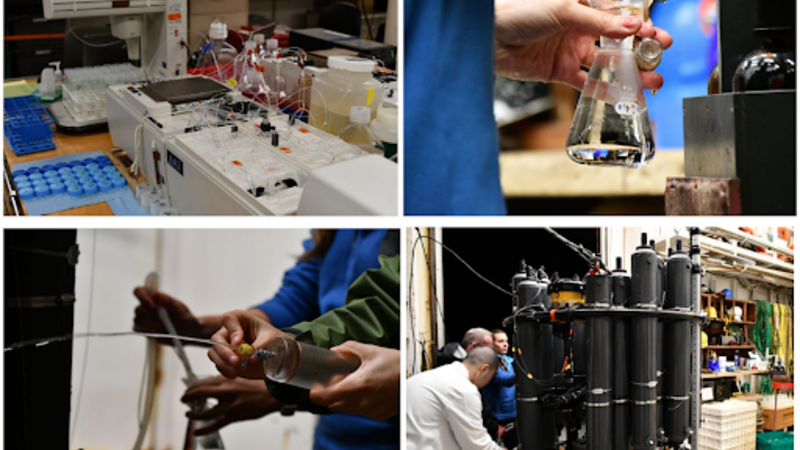
Water sampling on board. Top left: nutrient lab, where the concentration of nutrients such as nitrate, phosphate and silicate is analysed. Top right: oxygen sampling. Bottom left: CFCs sampling. Bottom right: taking samples directly from the CTD. Photos by Laura Cimoli.
According to Laura:
In a typical 12-h night shift we would sample and analyse about two stations, following strict procedures put in place to guarantee safety and efficiency. For example, we use something similar to military radio language at each step of the instrument deployment and recovery. The best shifts are the “boring” ones: it means everything is going according to plan!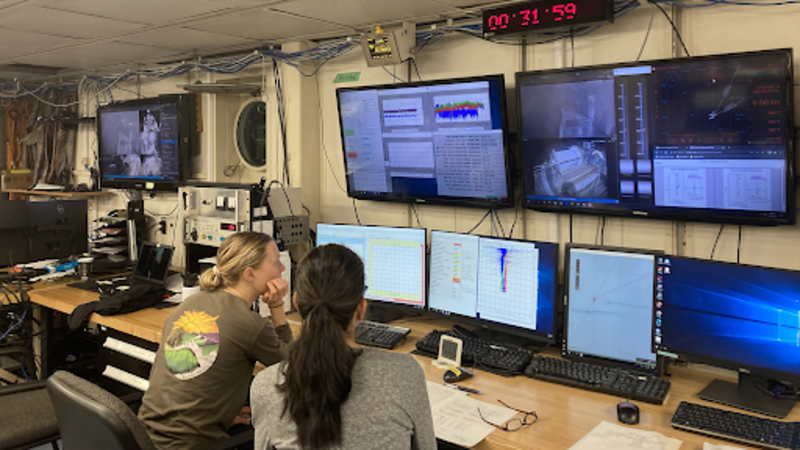
Shannon McClish and Kristy McTaggart sitting at the CTD console. Photo by Laura Cimoli.
It is important to maintain such observations to monitor how our oceans, and hence our climate, are changing and to increase the accuracy of our climate models in order to predict the future impacts of climate change. As the properties of the ocean change, it may become less able to absorb carbon and heat from the atmosphere. As the most powerful climate stabiliser on the planet, we need to understand it as best we can.